Scraping funeral data using Python 
When I was in business in the funeral industry, I was interested in my funeral home clients business. I had noticed that when they have had more funerals than usual recently, they were more likely to purchase more products from my company when visiting them. That lead me to the insight that funeral data being public, I could perhaps use it to my advantage.
I went on programming a web scraper using Python with Requests and BeautifulSoup modules that would collect funeral data from obituaries websites. It then prepare and transform the data and exports a report in HTML format. The report would help me decide as the manager and salesperson of the company on which region to focus sales efforts on a given month.
Here's most of the code with explanations:
        import os
os.chdir("../python projects/necrologie webscraping")
from get_ctq import ctq
from get_fcfq import fcfq
from necrologie_reporting import create_report

def necrologie_routine():
fcts = {"ctq":ctq, "fcfq":fcfq, "necrologie_reporting":create_report}

for fct_str, fct in fcts.items():
try:
    fct()
except Exception as e: print(e)

if __name__ == "__main__":
necrologie_routine()
        import re
import numpy as np
import sqlite3
from bs4 import BeautifulSoup
import dateparser
from open_session import open_session

def ctq():
    session = open_session() # requests module
    insert_statements = []
    db = sqlite3.connect('necrologie.db')
    cursor = db.cursor()
    cursor.execute("""select ad_id from ctq""")
    existing_ctq_ads = cursor.fetchall()
    existing_ctq_ads = [i[0] for i in existing_ctq_ads]
    base_url = "https://www.domainefuneraire.com/recherche/avis-de-deces/page-"
    ctq_existing_ad_counter = 0

    for page in range(1, 999): #MAX 999
        url = base_url + str(page)
        r = session.get(url)
        soup = BeautifulSoup(r.content, "html.parser")
        ads = soup.find_all("div", {"class":"summary"})

        if ctq_existing_ad_counter > 20: # we already got these ads in the DB
            break

        for ad in ads:
            #ad_id & ad_url
            raw_ad_url = ad.find("h4").find('a', href=True)['href']
            ad_url = "https://www.domainefuneraire.com" + raw_ad_url
            ad_id = re.search(r'\d+', raw_ad_url).group()

            if ad_id in existing_ctq_ads:
                ctq_existing_ad_counter += 1
                continue
            else:
                ctq_existing_ad_counter = 0
                pass

            #entreprise attribute
            entreprise = ad.find("p", {"class":"company"}).text

            #date deces attribute
            date_deces = ad.find("p", {"class":"date"}).text
            date_deces = dateparser.parse(date_deces).date()

            #année naissance attribute
            try:
                annee_naissance = ad.find("span", {"class":"naissance"}).text[0:4]
            except:
                annee_naissance = np.nan

            #ville attribute
            ville = ad.find("p", {"class":"city"}).text

            existing_ctq_ads.append(ad_id) # append newly scraped ad to existing
            insert_values = (ad_id, entreprise, date_deces, annee_naissance, ville,
                            ad_url)
            insert_statements.append(insert_values)

    cursor.executemany("""INSERT OR IGNORE INTO ctq (ad_id, entreprise, date_deces,
    annee_naissance, ville, ad_url) \
                       VALUES(?, ?, ?, ?, ?, ?)""", insert_statements)
    db.commit()
    db.close()
Data preparation, transformation, and aggregation for analysis. Report exported into an html document.
import sqlite3
import pandas as pd
import calendar
from datetime import datetime, timedelta
def create_report():
db = sqlite3.connect('necrologie.db')
"""get the first day of the month one year ago for the analysis time range"""
pd.options.display.float_format = '{:,.2f}'.format
one_year_ago = datetime.now() - timedelta(days=365)
date_first_day_of_month_year_ago = one_year_ago.replace(day=1)
"""get the last day of the last month for the analysis time range"""
one_month_ago = datetime.now() - timedelta(365/12)
last_day_of_last_month = calendar.monthrange(one_month_ago.year, one_month_ago.month)[1]
date_last_day_of_last_month = one_month_ago.replace(day=last_day_of_last_month)
# concatenate ctq and fcfq addresses tables
fcfq_a_df = pd.read_sql("select site_web, ville, province, code_postal, \
compagnie_mere from fcfq_addresses", db)
ctq_a_df = pd.read_sql("select entreprise, ville, province, code_postal, \
compagnie_mere from ctq_addresses", db)
addresses_df = pd.concat([fcfq_a_df, ctq_a_df], sort=False)
# get the data from database, and merge fcfq and ctq obituaries data with company address data
fcfq_d_df = pd.read_sql("select ad_id, date_deces, site_web from fcfq", db)
fcfq_df = pd.merge(fcfq_d_df, addresses_df, how='right', on='site_web', sort=False)
ctq_d_df = pd.read_sql("select ad_id, date_deces, entreprise from ctq", db)
ctq_df = pd.merge(ctq_d_df, addresses_df, how='right', on='entreprise', sort=False)
ctq_fcfq_df = pd.concat([ctq_df, fcfq_df], sort=False) # concatenate CTQ and FCFQ datasets
ctq_fcfq_df['date_deces']= pd.to_datetime(ctq_fcfq_df['date_deces']) # convert date string to datetime
ctq_fcfq_df = ctq_fcfq_df.dropna(subset=['date_deces'])
ctq_fcfq_df['annee'] = ctq_fcfq_df['date_deces'].dt.year # add year column
ctq_fcfq_df['mois_de_lannee'] = ctq_fcfq_df['date_deces'].dt.month # add month column
# create pivot table
global ctq_fcfq_pivot
ctq_fcfq_pivot = pd.pivot_table(ctq_fcfq_df[(ctq_fcfq_df['date_deces'] >= date_first_day_of_month_year_ago) &
(ctq_fcfq_df['date_deces'] <= date_last_day_of_last_month)],
values=['ad_id'], index=['compagnie_mere'],
columns=['annee', 'mois_de_lannee'], aggfunc=['count'])
ctq_fcfq_pivot = ctq_fcfq_pivot.rename_axis(None) # remove empty index header row
ctq_fcfq_pivot.columns = ctq_fcfq_pivot.columns.droplevel([0,1,2]) # remove useless headers
ctq_fcfq_pivot['moyenne'] = ctq_fcfq_pivot.mean(axis=1) # monthly average column
ctq_fcfq_pivot['coefvar'] = \
ctq_fcfq_pivot.std(axis=1) / ctq_fcfq_pivot['moyenne'] # var coeff
ctq_fcfq_pivot['dernier_mois'] = \
ctq_fcfq_pivot.iloc[:,11] - ctq_fcfq_pivot['moyenne']
ctq_fcfq_pivot = ctq_fcfq_pivot.dropna()
ctq_fcfq_pivot.iloc[:,:12] = ctq_fcfq_pivot.iloc[:,:12].applymap('{:,.0f}'.format)
html_string = """
<html>
<head><title>HTML Pandas Dataframe with CSS</title>
<script src="https://code.jquery.com/jquery-3.3.1.js"></script>
<script src="https://cdn.datatables.net/1.10.20/js/jquery.dataTables.min.js"></script>
<script src="https://cdn.datatables.net/1.10.20/js/dataTables.bootstrap4.min.js"></script>
</head>
<link rel="stylesheet" href="https://cdnjs.cloudflare.com/ajax/libs/twitter-bootstrap/4.1.3/css/bootstrap.css">
<body style="margin:2%">
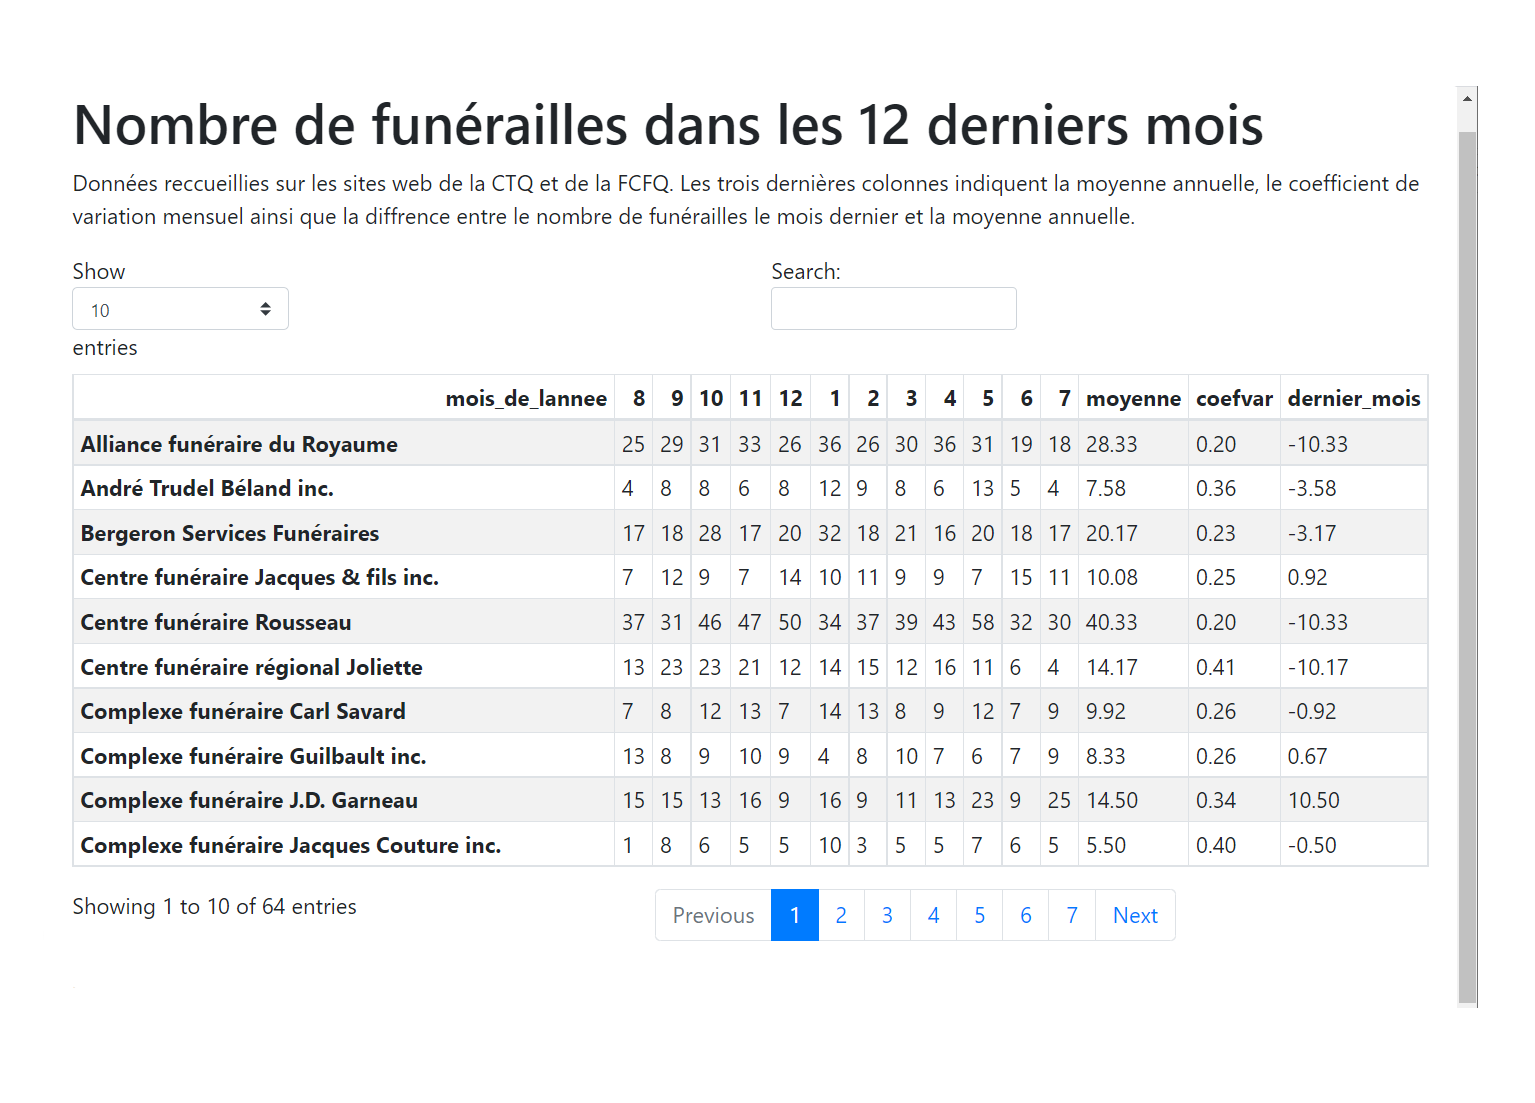
<h1>Nombre de funérailles dans les 12 derniers mois</h1>
<p>Données reccueillies sur les sites web de la CTQ et de la FCFQ. Les trois dernières colonnes indiquent la moyenne annuelle, le coefficient de variation mensuel\
ainsi que la diffrence entre le nombre de funérailles le mois dernier et la moyenne annuelle.
</p>
{table}
<script>
$(document).ready(function () {{
$('#myID').DataTable();
}});
</script>
</body>
</html>.
"""
with open('report.html', 'w') as f:
f.write(html_string.format(table=ctq_fcfq_pivot.to_html(classes='table table-striped table-bordered table-bordered table-sm', table_id='myID')))
db.close()
Screenshot of the report
The number of funerals is displayed by client, along with the 12-months average, the variation coefficient (gives an idea if the client experiences a stable revenue flow or not), and the difference between the last month and the 12-months average.
Sales effort can be focused on clients who've had a great last month, especially if they experienced high variation during the year.